

Introduction
In an earlier article, I introduced Kubernetes. We deployed an application with:
Laravel API
nginx
Worker
Scheduler
Vue frontend
A migration job
You can read the article here.
In this one, we’ll discover the autoscaling features of Kubernetes using this example project.
Liveness and readiness probes
The next part is crucial. As you may know, Kubernetes has self-healing properties. Meaning it kills, starts, and restarts pods if they are unhealthy. But how does it know when a pod is unhealthy? There are obvious situations, for example, when your worker process exits with code 1. But we can also configure more advanced checks, for example, restart the API if it takes more than 1s to respond.
These are called "probes" in k8s. They are basically the same as health checks in docker-compose or Swarm but much easier to write down.
It's pretty easy to confuse them so here's a quick definition:
readinessProbeasks the container: "Are you ready to work?"On the other hand,
livenessProbeasks the container: "Are you still alive?"
So readinessProbe plays a role when the container is being started, while livenessProbe is important when the container is already running.
readinessProbe indicates whether a container is ready to serve requests. It ensures that it is fully initialized before starting to receive incoming traffic. If a container fails the readinessProbe, it is temporarily removed from load balancing until it passes the probe. This allows k8s to avoid sending traffic to containers that are not yet ready or are experiencing problems.
livenessProbe is used to determine whether a container is running as expected, and if it's not, Kubernetes takes action based on the probe's configuration. It helps in detecting and recovering from failures automatically. If a container fails the livenessProbe, Kubernetes will restart the container.
These probes together help ensure the high availability of your app by making sure containers are running correctly (livenessProbe) and ready to serve requests (readinessProbe).
Let's configure liveness and readiness probes for every container!
API probes
template:
    metadata:
      labels:
        app: api
    spec:
      containers:
        - name: api
          image: martinjoo/posts-api:latest
          imagePullPolicy: Always
          livenessProbe:
            tcpSocket:
              port: 9000
            initialDelaySeconds: 20
            periodSeconds: 30
            failureThreshold: 2
          readinessProbe:
            tcpSocket:
              port: 9000
            initialDelaySeconds: 10
            periodSeconds: 30
            failureThreshold: 1
There are 3 different types of probes:
tcpSocket
httpGet
exec
The API exposes port 9000 over TCP so in this case tcpSocket is the one we need. Both livenessProbe and readinessProbe has the same properties:
initialDelaySecondstells k8s to wait 20 seconds before sending the request.periodSecondstells k8s to run the probe every 30 seconds.failureThresholdinstructs k8s to tolerate only 2 failed probes.
The following sentence comes from the Kubernetes documentation:
A common pattern for liveness probes is to use the same low-cost HTTP endpoint as for readiness probes, but with a higher failureThreshold. This ensures that the pod is observed as not-ready for some period of time before it is hard killed.
This is why I use the same config but failureThreshold is set to 2 in the livenessProbe. The initialDelaySeconds is also a bit higher.
nginx probes
livenessProbe:
  httpGet:
    path: /api/health-check
    port: 80
  initialDelaySeconds: 30
  periodSeconds: 30
  failureThreshold: 2
readinessProbe:
  httpGet:
    path: /api/health-check
    port: 80
  initialDelaySeconds: 20
  periodSeconds: 30
  failureThreshold: 1
Since nginx exposes an HTTP port we can use the httpGet type which is pretty straightforward to use. I'm using a bit higher initialDelaySeconds because nginx needs the API.
An httpProbe fails if the response is not 2xx or 3xx.
worker probes
livenessProbe:
  exec:
    command:
      - sh
      - -c
      - php artisan queue:monitor default
  initialDelaySeconds: 20
  periodSeconds: 30
  failureThreshold: 2
readinessProbe:
  exec:
    command:
      - sh
      - -c
      - artisan queue:monitor default
  initialDelaySeconds: 10
  periodSeconds: 30
  failureThreshold: 1
Workers don't expose any port, so I just run queue:monitor command with the exec probe type. You can also use an array-type notation:
command: ["sh", "-c", "php artisan queue:monitor default"]frontend probes
livenessProbe:
  httpGet:
    path: /
    port: 80
  initialDelaySeconds: 40
  periodSeconds: 30
  failureThreshold: 2
readinessProbe:
  httpGet:
    path: /
    port: 80
  initialDelaySeconds: 30
  periodSeconds: 30
failureThreshold: 1timeoutSeconds
If something is wrong with some of your pods based on the livenessProbe you can see it in the events section in the output of kubectl describe pod <pod-name>
For example:
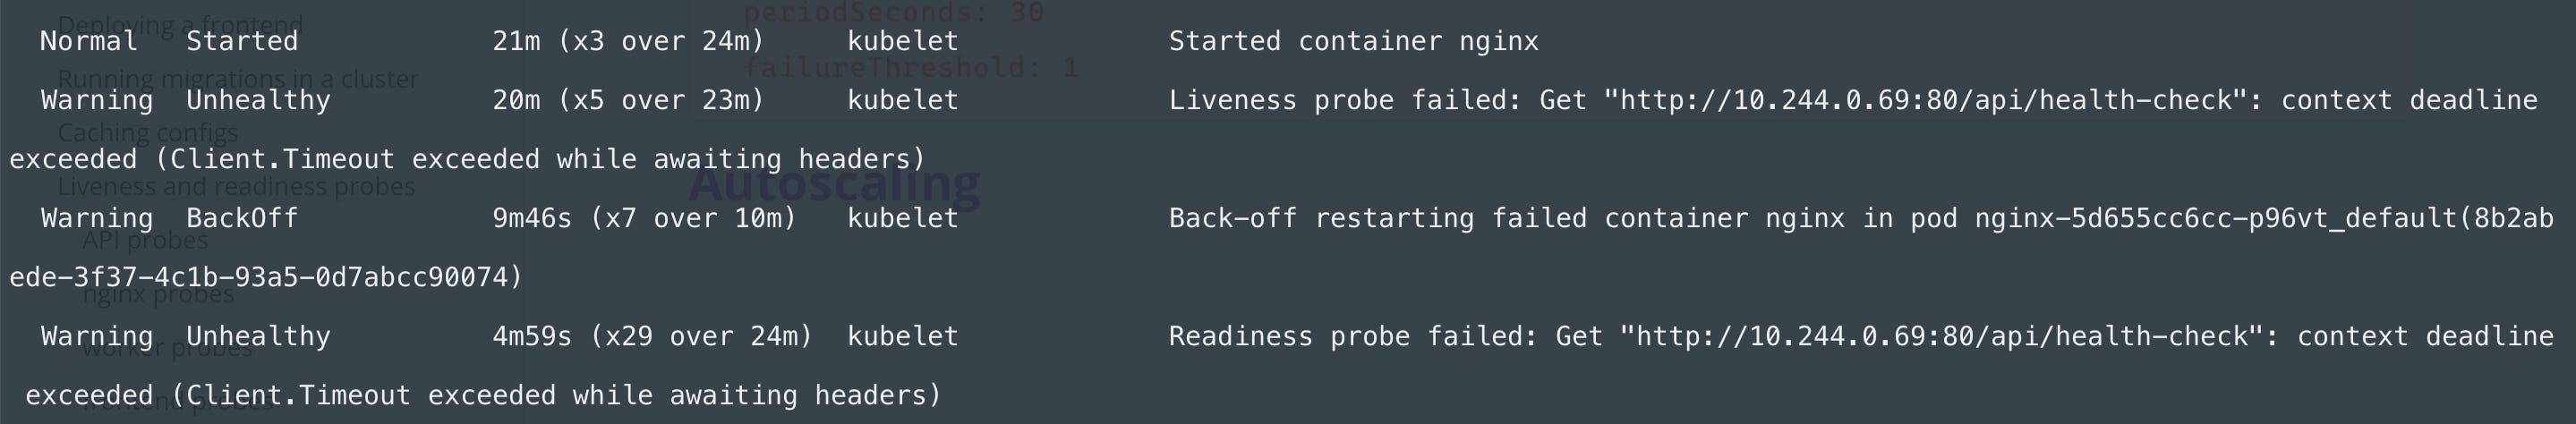
You can see that it started 21 minutes ago, but then the liveness probe failed 20 minutes ago so Kubernetes restarted the container but then the readiness probe failed.
We can check the logs of the nginx container:
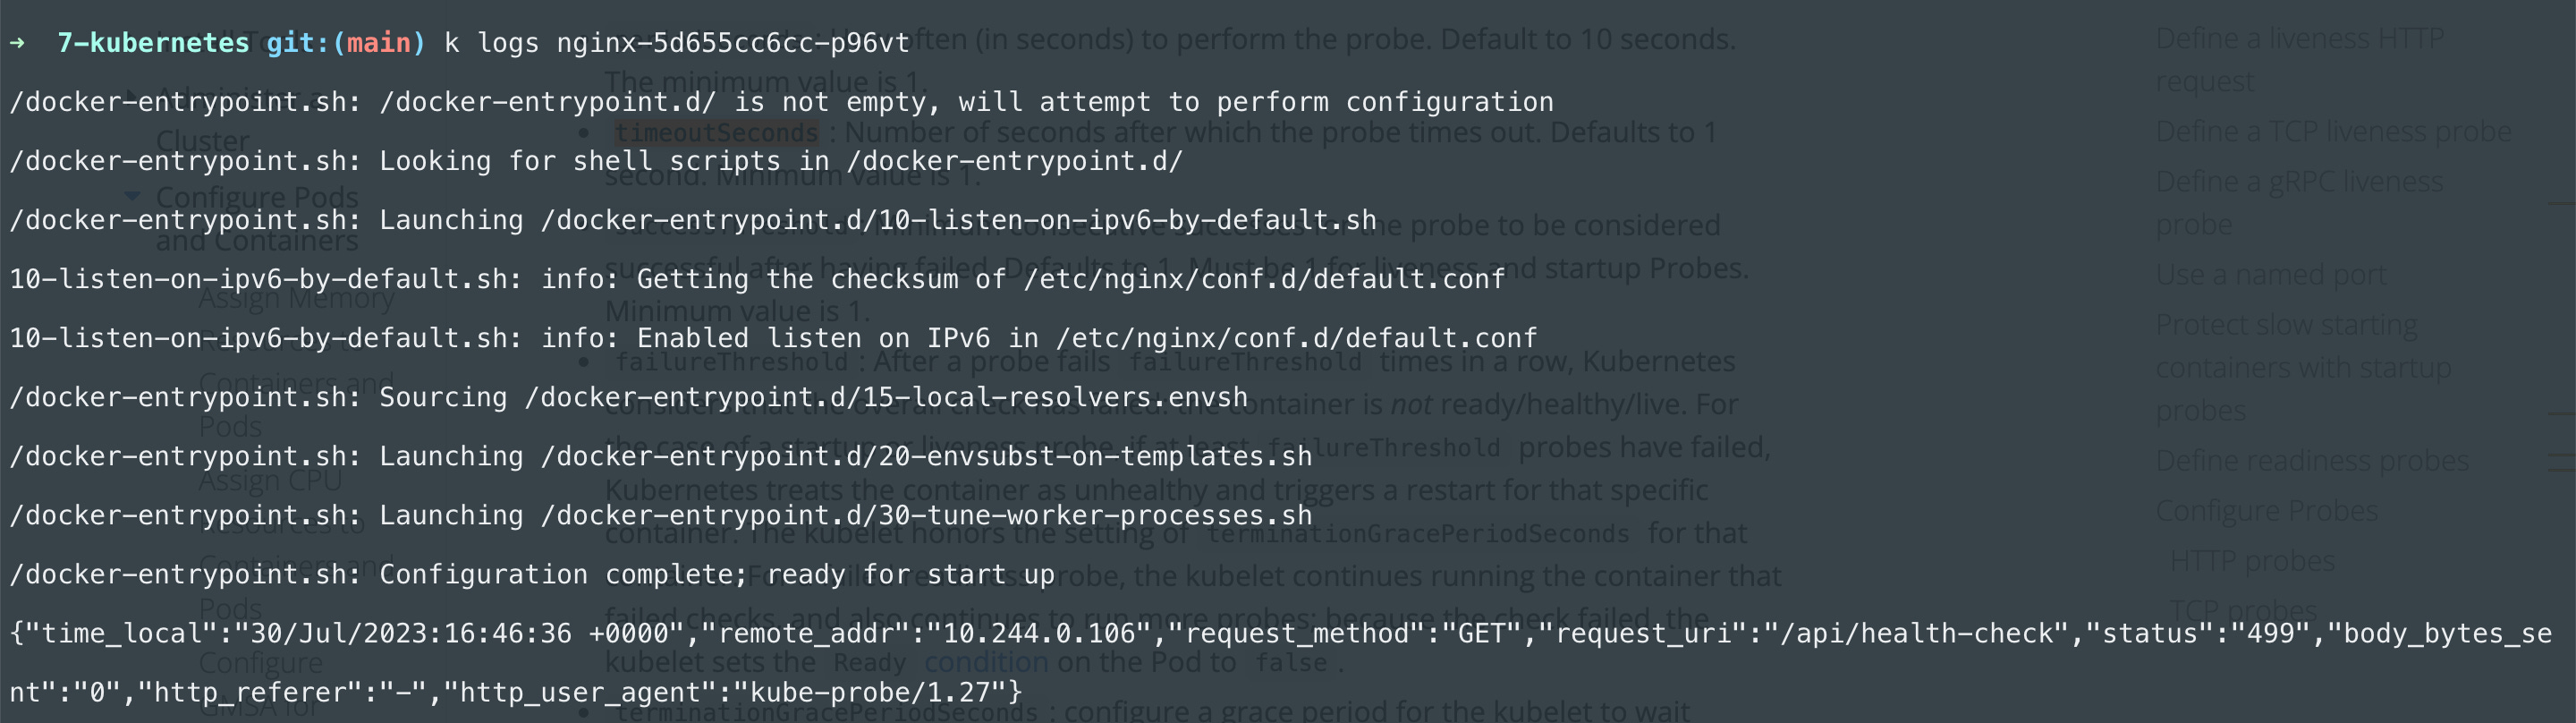
The status code is 499 which is an nginx-specific code that means the client closed the connection before the server could send the response. This is because there's another option for probes called timeoutSeconds which defaults to 1. So if your container doesn't respond in 1 second the probe fails.
It's a good thing because your probe endpoint should be pretty low-cost and very fast. So if 1 second is not enough for your container to respond there's certainly a problem with it. In my case, I made this situation happen on purpose. I decreased the cluster size, then the server size, then I configured too high request limits (later) to the containers so the whole cluster is dying right now.
If something like that happens you can see it in kubectl get pods:
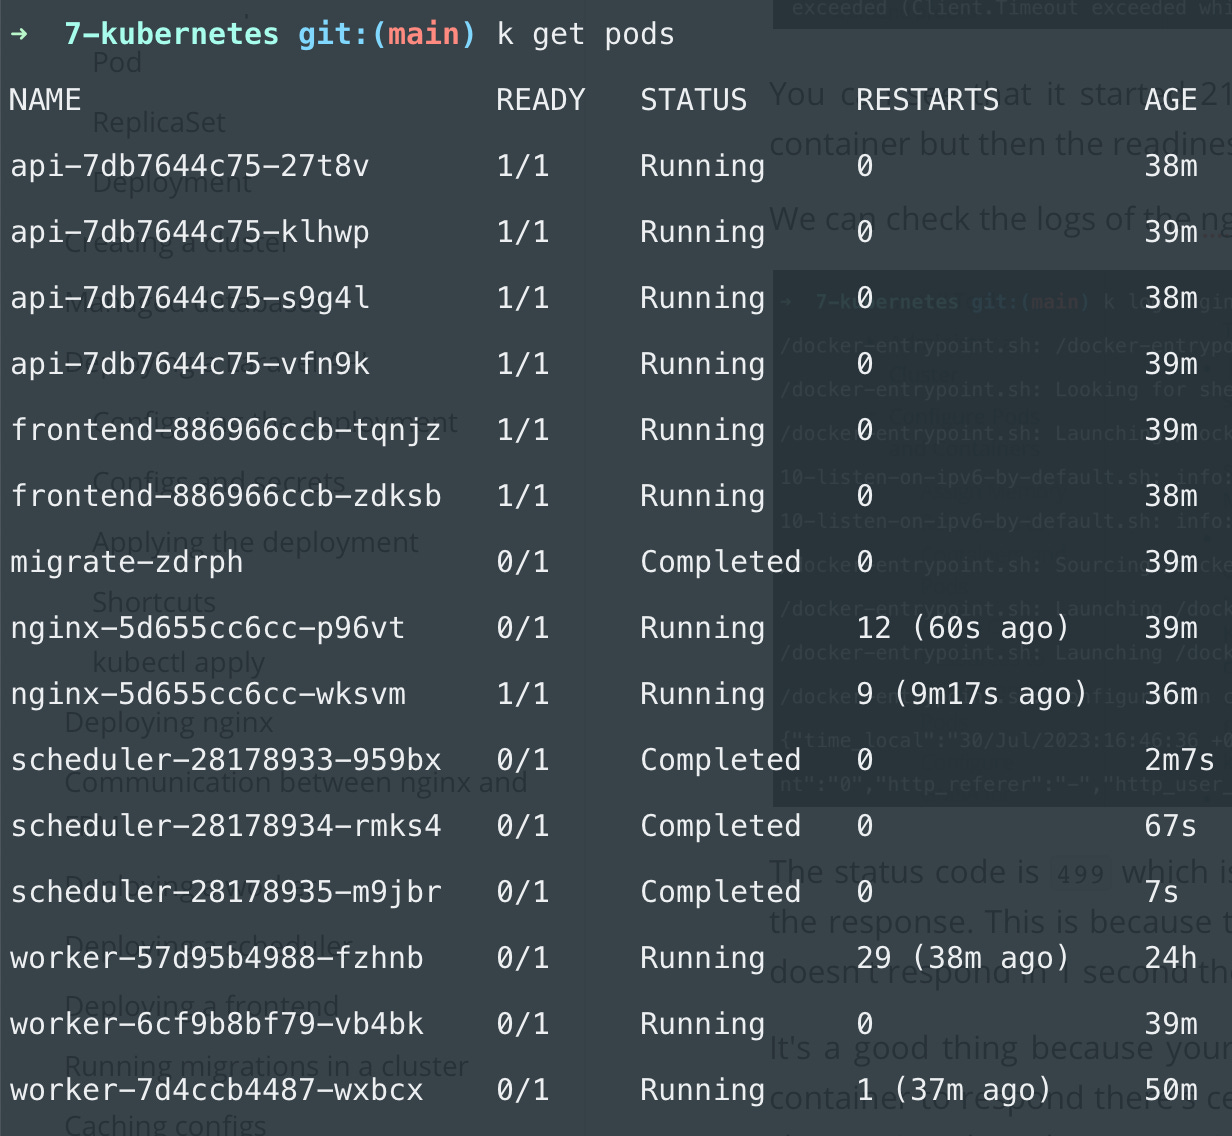
There is a high number of restarts everywhere. And READY 0/1 means that the container is not ready so the readiness probe failed. You can see that all of my workers failing the readiness probe.
Of course, on the DigitalOcean dashboard, you can always adjust the autoscaling settings:
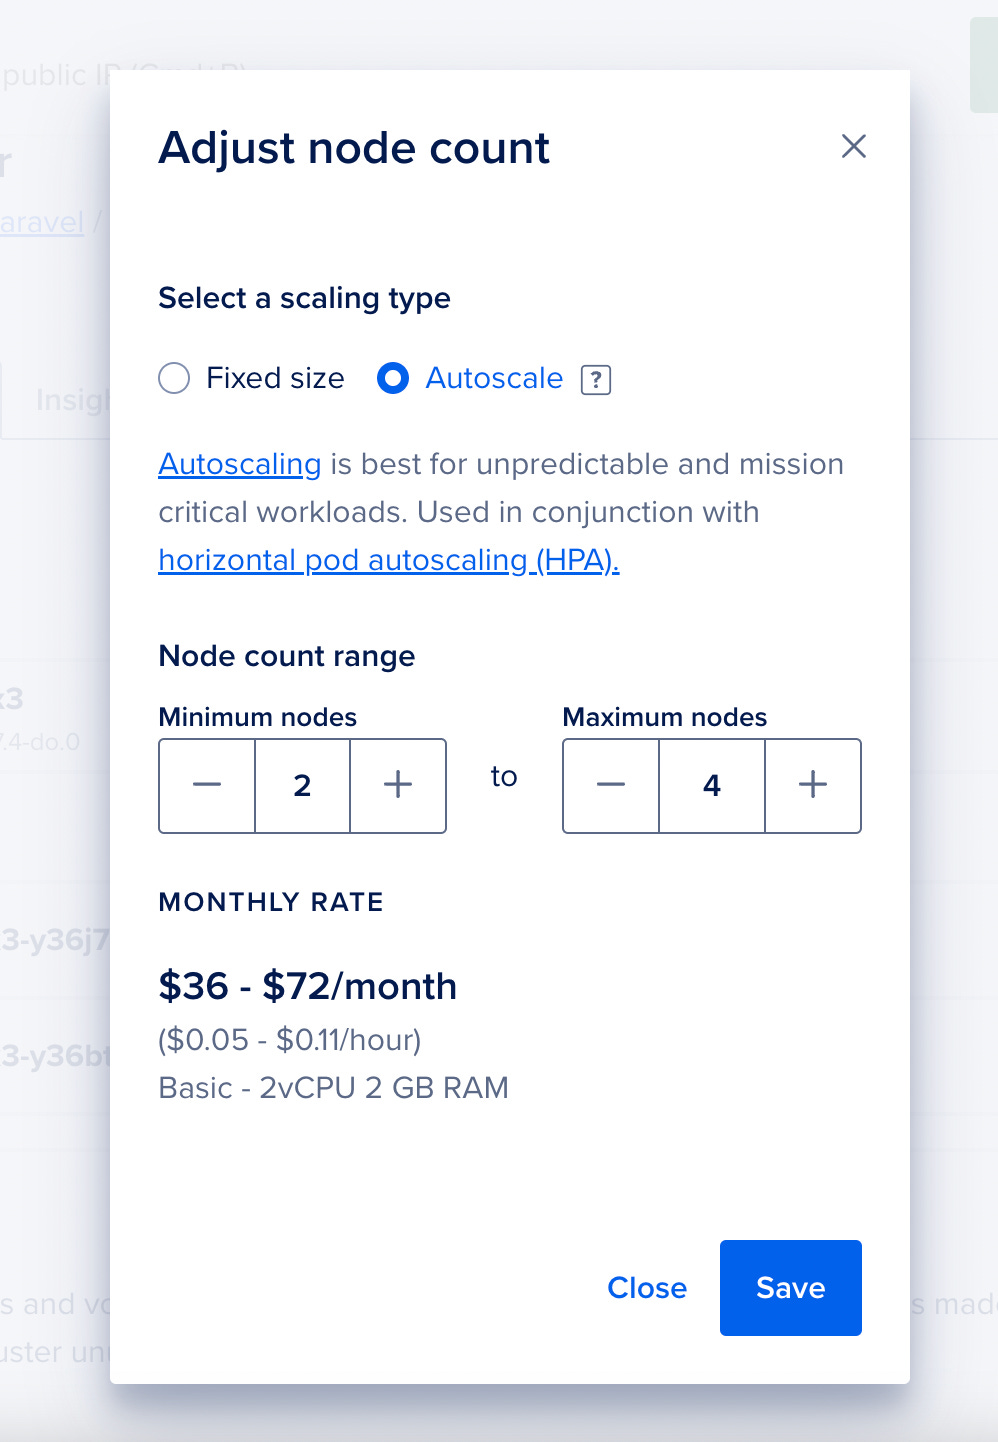
Autoscaling pods
The cluster is already autoscaled in terms of nodes. However, we still have a fixed number of replicas. For example, this is the API deployment:
spec:
  replicas: 2
  containers:
    - name: api
      image: martinjoo/posts-api:latest
If you want your pods to run a dynamic number of replicas you should delete these replicas settings.
We need a new resource type called HorizontalPodAutoscaler. Each deployment you want to scale will have a dedicated HPA. This is what it looks like:
Keep reading with a 7-day free trial
Subscribe to Computer Science Simplified to keep reading this post and get 7 days of free access to the full post archives.